HRGSA
BMP Project / Areawide II Handbook
Phenology Models for Orchard
![]()
![]()
What are Phenology Models & Why Use Them?
s
Time
sprays for maximum efficacy
s
Eliminate
unnecessary sprays
s
Reduce
overall pesticide loading of the environment
s
Reduce
potential for resistance development
By using
these models, you may realize savings that result from lower material and
application costs. Also, your returns
may be increased from better packouts. It should be emphasized that models are tools
that are used in the overall decision-making process, but are not intended to
be relied on exclusively. You need to
use common sense as well.
s
Codling moth development model: a degree-day
model that can help you time spray applications. There are similar models for obliquebanded leafroller
and San Jose scale development.
s
Cougarblight fire blight risk calculator:
estimates the potential for the build up of fire blight bacteria in
blossoms, and can help you decide if and when to spray.
s
Pear scab infection period model helps determine when the conditions necessary for
scab infections have occurred, again helping you decide if and when to spray.
s
Pear and apple scab infection season models tell you when ascospores are no longer being produced and the danger of
primary scab infections has past so you can decide not to spray even if it
rains.
Models
are a way of simulating the developmental events in the life cycle of an
organism (pest or disease). Some are relatively simple; others may involve the
use of complex mathematical equations.
Fortunately, they are often integrated into a look up table or a
computer program that is convenient to use.
Because the rate of development of pests and diseases is primarily
driven by temperature, it is necessary to have weather data available for
calculating the models. For some
diseases, such as pear and apple scab, that depend on water for spore dispersal
or germination, it is also necessary to have data on leaf or blossom
wetness. You may collect your own
weather data and calculate the models using look-up tables. Using the web-based tools that are
demonstrated below provides the following advantages:
s
access to weather data that is
collected automatically
s
simplified data management and model
calculations
s
access
to summaries that have been completed for you
s
access
to e-mail alerts on critical events in pest or disease development
Accessing
Phenology Models for Hood River Valley Orchards
Every 15 minutes data are sent to a receiver at the MCAREC. There, the
data are downloaded to a computer that transfers the data to the Integrated
Plant Protection Center (IPPC) at OSU
in
Currently, there are four web-based resources to be aware
of:
s
MCAREC Pest
& Disease Model Summaries
s
s
Online IPM Weather Data
for
s
Online Phenology and
Degree-day Models
The key features and access to each are described below.
Please note that during the 2004 growing season a new weather station network
and web interface, the IFPNet, will be expanded from
MCAREC Pest & Disease Model Summaries
The MCAREC Pest & Disease
Model Summaries are periodically updated summaries of relevant pest and disease
models using the weather data from the seven weather stations in the MCAREC Network. They
are posted on the MCAREC website. This webpage also includes links to
development tables for each of these pests as well as a list of biofix dates for each model and location. It is important to know that the biofix dates for most of these models are estimated.
 To access these summaries, go to
the following website: http://oregonstate.edu/dept/mcarec/pestmodel_dir.html.
You will see a list of summaries.
Click on the most recent date to see the most current summary.
To access these summaries, go to
the following website: http://oregonstate.edu/dept/mcarec/pestmodel_dir.html.
You will see a list of summaries.
Click on the most recent date to see the most current summary.
______________________________________________________________________________
Oregon Pest Alert System http://ipmnet.bcc.orst.edu/pestalert
The Oregon Fruit Crop Pest Alert System (ORFCPAS) was designed to facilitate the exchange of pest
management information among growers, field reps, and extension and research
personnel. The system integrates email,
World Wide Web, and database systems.
The main feature of the system is the delivery of
near-real time pest warnings and management information. For example, you could receive immediate
notices on pear psylla egg laying, codling moth biofix, or the occurrence of a scab infection period
without the delay of other notification systems. In addition to the email pest alerts, there
are links to pest management related research reports, as well as other tree
fruit and pest management web sites.
Use of this system is free of charge and is available to
anyone who has Internet access. In order
to receive pest alerts by email, you first need to register by entering your
name and email address. You will view
the messages on the ORFCPAS website. You can customize the system to your specific
interests by choosing or subscribing to receive notifications for different
crops. Once subscribed, users are
alerted as new messages are posted. Registered users can enter their
location-specific pest monitoring data over the web for distribution through
the system.
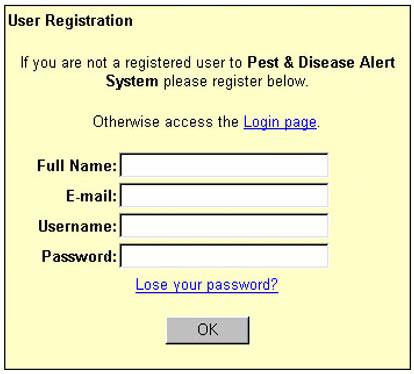
To register to use the system:
1.
go
to the homepage at: http://ipmnet.bcc.orst.edu/pestalert/index.cfm
2.
select
“join” (located in the Login & search menu bar).
3.
fill
in your name, e-mail address, user name, and password; then click on “OK.”
Once you have registered, you may
select the crops you will receive pest alerts for:
1.
On
the homepage, click on “Options” in the Features menu bar.
2.
Check
the boxes for the crops you are interested in.
3.
Check
the E-mail Notification box.
4.
The
last configuration step for receiving e-mail alerts is to subscribe to topics
within each crop. This is done on the
homepage by pointing and clicking on the circle in front of the topics of
interest. When selected the circle will
appear orange.
______________________________________________________________________________
Online IPM Weather Data for Hood River Valley http://ipm-dd.orst.edu/hr/
![]()
http://ipm-dd.orst.edu/hr/
o
The pear scab infection period model is a degree-hour
adaptation of the Spotts Table that uses temperature
and leaf wetness data to calculate when environmental conditions required for a
pear infection period are occurring. To
check for the current status of infection periods, click on “today” for the
appropriate weather station. If you want
to see if there has been an infection period during the preceding 5 days,
choose from one of the “today-x’’ selections.
You will find background information on the model
by clicking on “pear scab model test”.
You should read the disclaimer by clicking on “pear scab model test” and
know that this model is still being tested
The new model is similar to the Cougarblight
model in that it calculates degree hours to determine if an infection period
has occurred. It uses a leaf wetness
reading of two as the threshold for leaf wetness.
Output
page for pear scab infection season.
This website allows you to choose from several different phenology models and set your own parameters for running
them. Additionally, you may upload your
own weather data and use forecasted conditions or historical weather averages
to extend the model predictions later into the season.
Model
output includes a summary of model input parameters, a table of key events in
the development and control of the pest, a table listing daily maximum and minimum
temperatures, precipitation, degree-days, and total degree-days accumulated
since the biofix.
If you have any additional questions about these
resources or how to access or use any of the models, please contact Steve Castagnoli at OSU Extension
Service (541) 386-3343.